 Trade Guide
Trade Guide
Each example follows the same structure: IC Konsole flags the participation → chart confirms the setup → price moves. IC Konsole does not tell you when to enter; it tells you where to look. Price action and pattern confirmation do the rest.
These are trend-following setups. Core checklist before every entry:
- EMAs in bullish order on the higher timeframe (21 > 50 > 200)
- IC Konsole has flagged the asset: B+ or A+ preferred
- A bullish pattern confirms on the lower timeframe (bull flag, engulfing, 200 EMA touch)
- Entry on pattern confirmation, not before
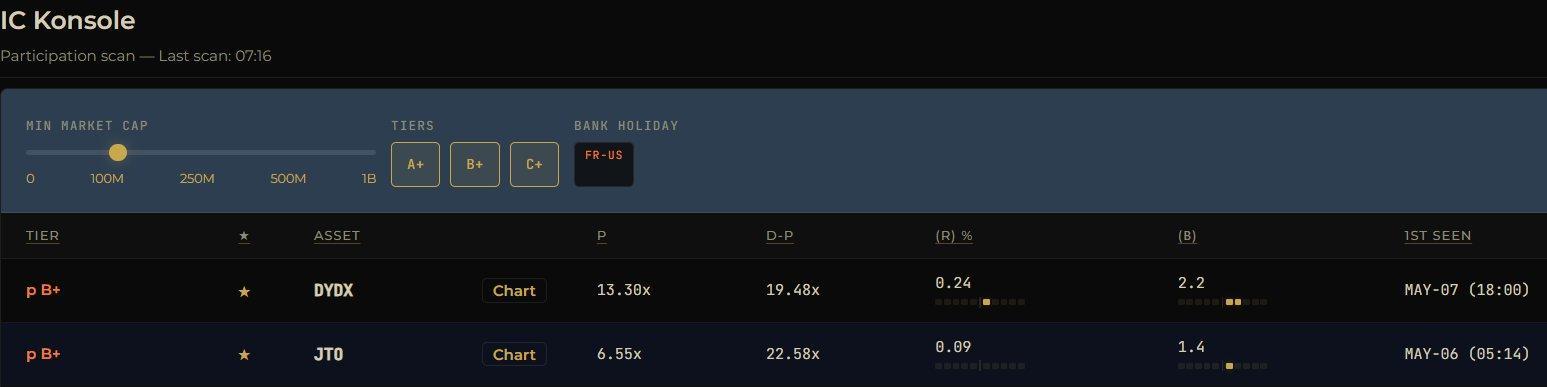
IC Konsole flagged JTO as B+ on MAY-06 at 05:14, hours before the move began. P: 6.55x showed participation at over 6x its historical average. D-P: 22.58x confirmed this was sustained across the full day, not a spike. (B): 1.4 confirmed healthy BTC-aligned beta.
| Signal Data | Value | Interpretation |
|---|---|---|
| Tier | B+ | Institutional participation with BTC alignment |
| P | 6.55x | Running at 6.5x historical average |
| D-P | 22.58x | Full day at 22x norm. Sustained, not a spike. |
| (B) Beta | 1.4 | Within B+ healthy range. BTC-aligned. |
| 1ST SEEN | MAY-06 05:14 | Early session. Hours before the pattern formed. |
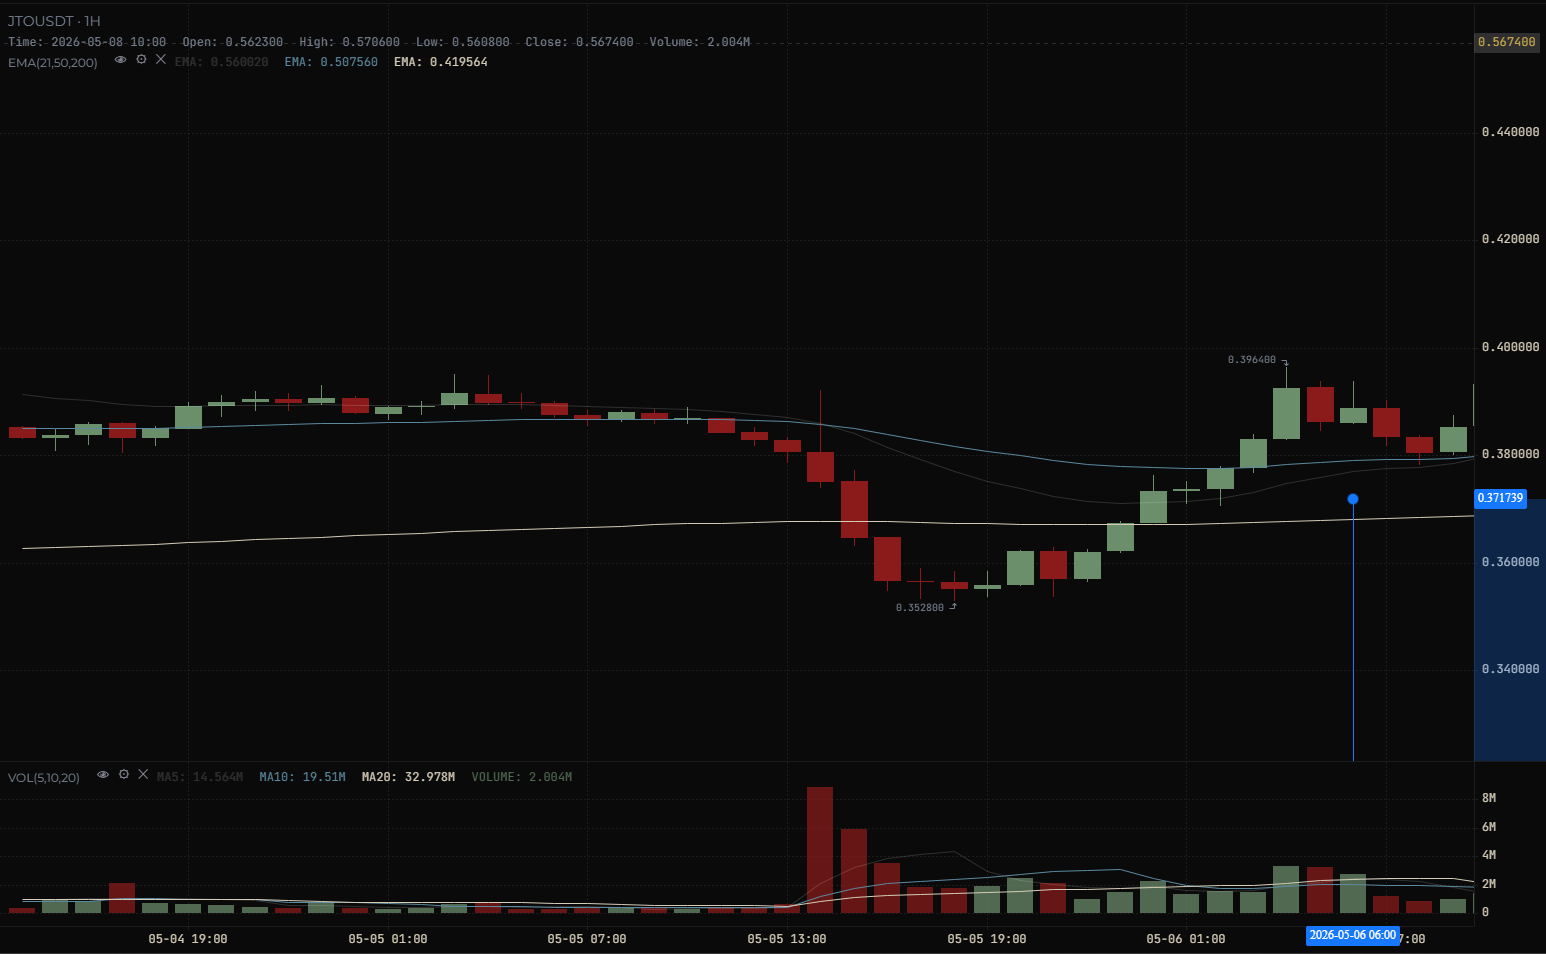
EMAs in bullish order at signal time. Trend structure already in place.
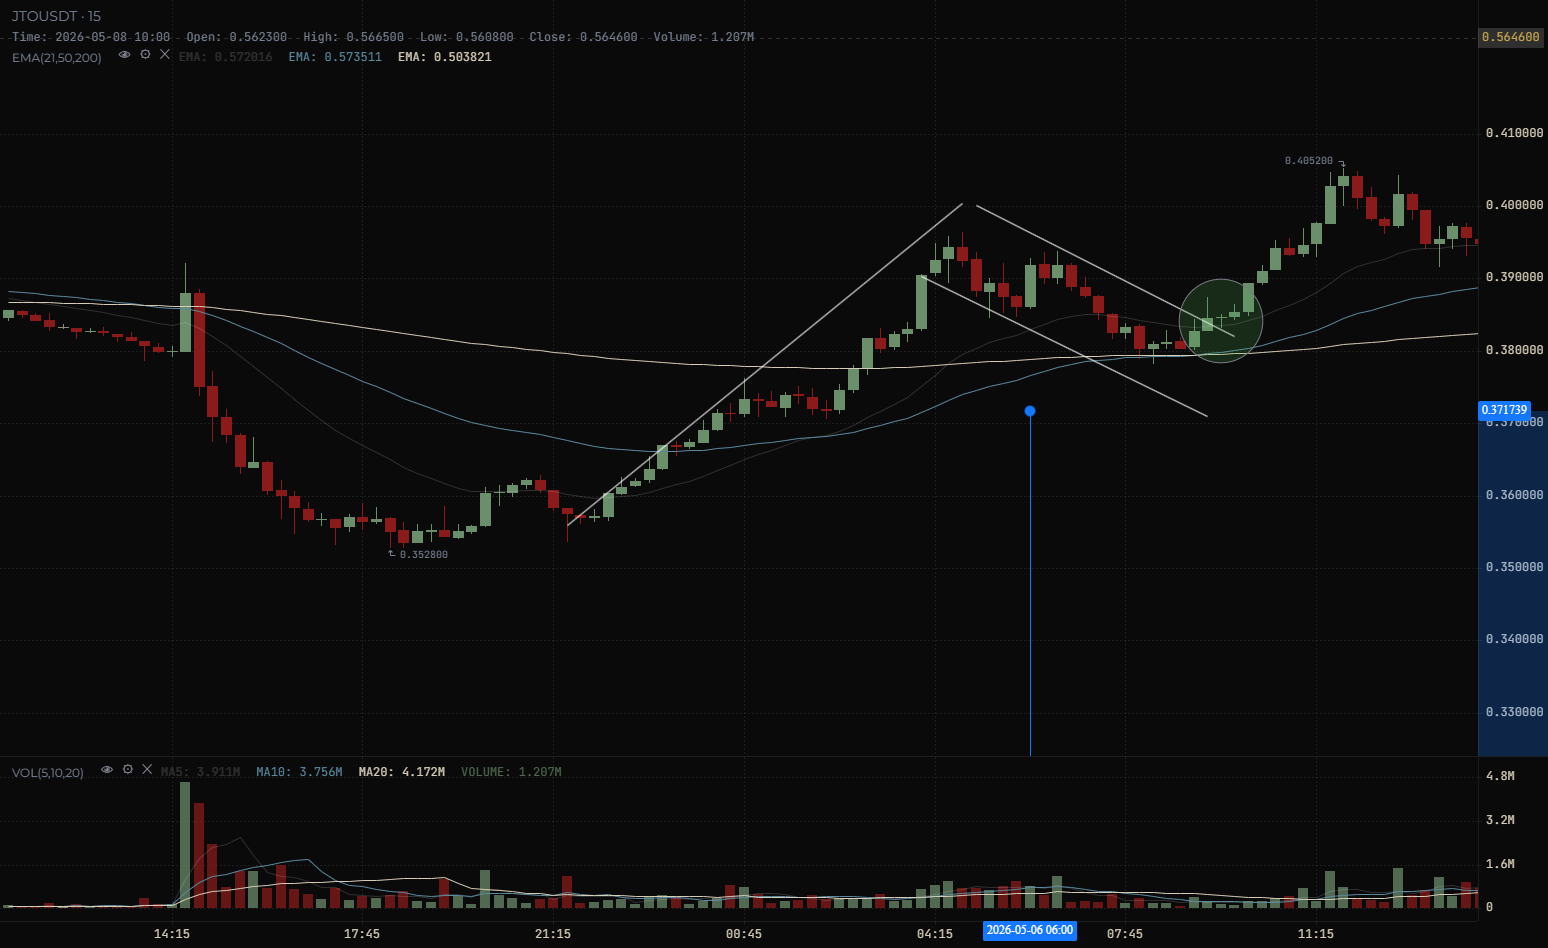
~3hrs after signal, a bull flag formed on the 15m. Price touched the 200 EMA during flag consolidation: a high-confluence entry zone. Flag breakout launched the continuation to 0.6959.
The rule: scanner flags early, pattern confirms the entry, trend does the work.
- IC Konsole flagged hours before the pattern: patience rewarded
- 1H EMA structure confirmed trend already in place
- 15m bull flag + 200 EMA touch = entry trigger, not the scanner
- D-P: 22.58x = sustained institutional interest across the full day
- +78% from signal low to peak. Trend continuation: held for full move.
This example is different. DYDX was late in a 4H trend, not an early participation signal. Strong IC Konsole data, but macro context demanded a quick scalp mentality, not a trend hold. This is disciplined use: knowing what the signal is telling you and what it isn't.
DYDX appeared as B+, 1ST SEEN MAY-07 18:00. P: 10.08x and D-P: 27.30x were strong. (B): 1.9 solid. But context mattered: 100M to 250M market cap, late in the trend, approaching major resistance. Signal: valid. Trade type: scalp only.
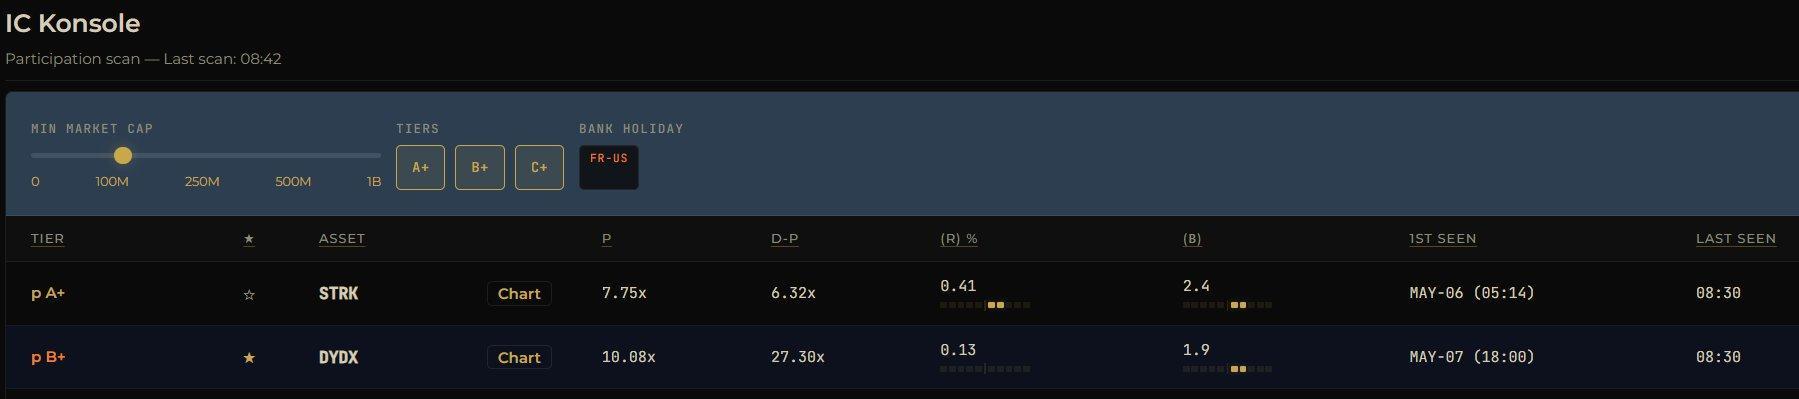
| Signal Data | Value | Interpretation |
|---|---|---|
| Tier | B+ | Significant participation with BTC alignment |
| P | 10.08x | High. Running at 10x historical average. |
| D-P | 27.30x | Very high daily conviction. But late in the trend. |
| (B) Beta | 1.9 | Solid BTC beta. Healthy B+ range. |
| 1ST SEEN | MAY-07 18:00 | Evening. Late in the trading session. |
| Market Cap | 100M – 250M | Lower cap. Thinner depth. Faster reversals. |
DYDX had trended from 0.220 down to 0.078. Recovery was strong but price approached key resistance at 0.182, the prior January 2026 breakdown level. Not an early entry. Late-trend breakout attempt at major resistance = shorter leash required.
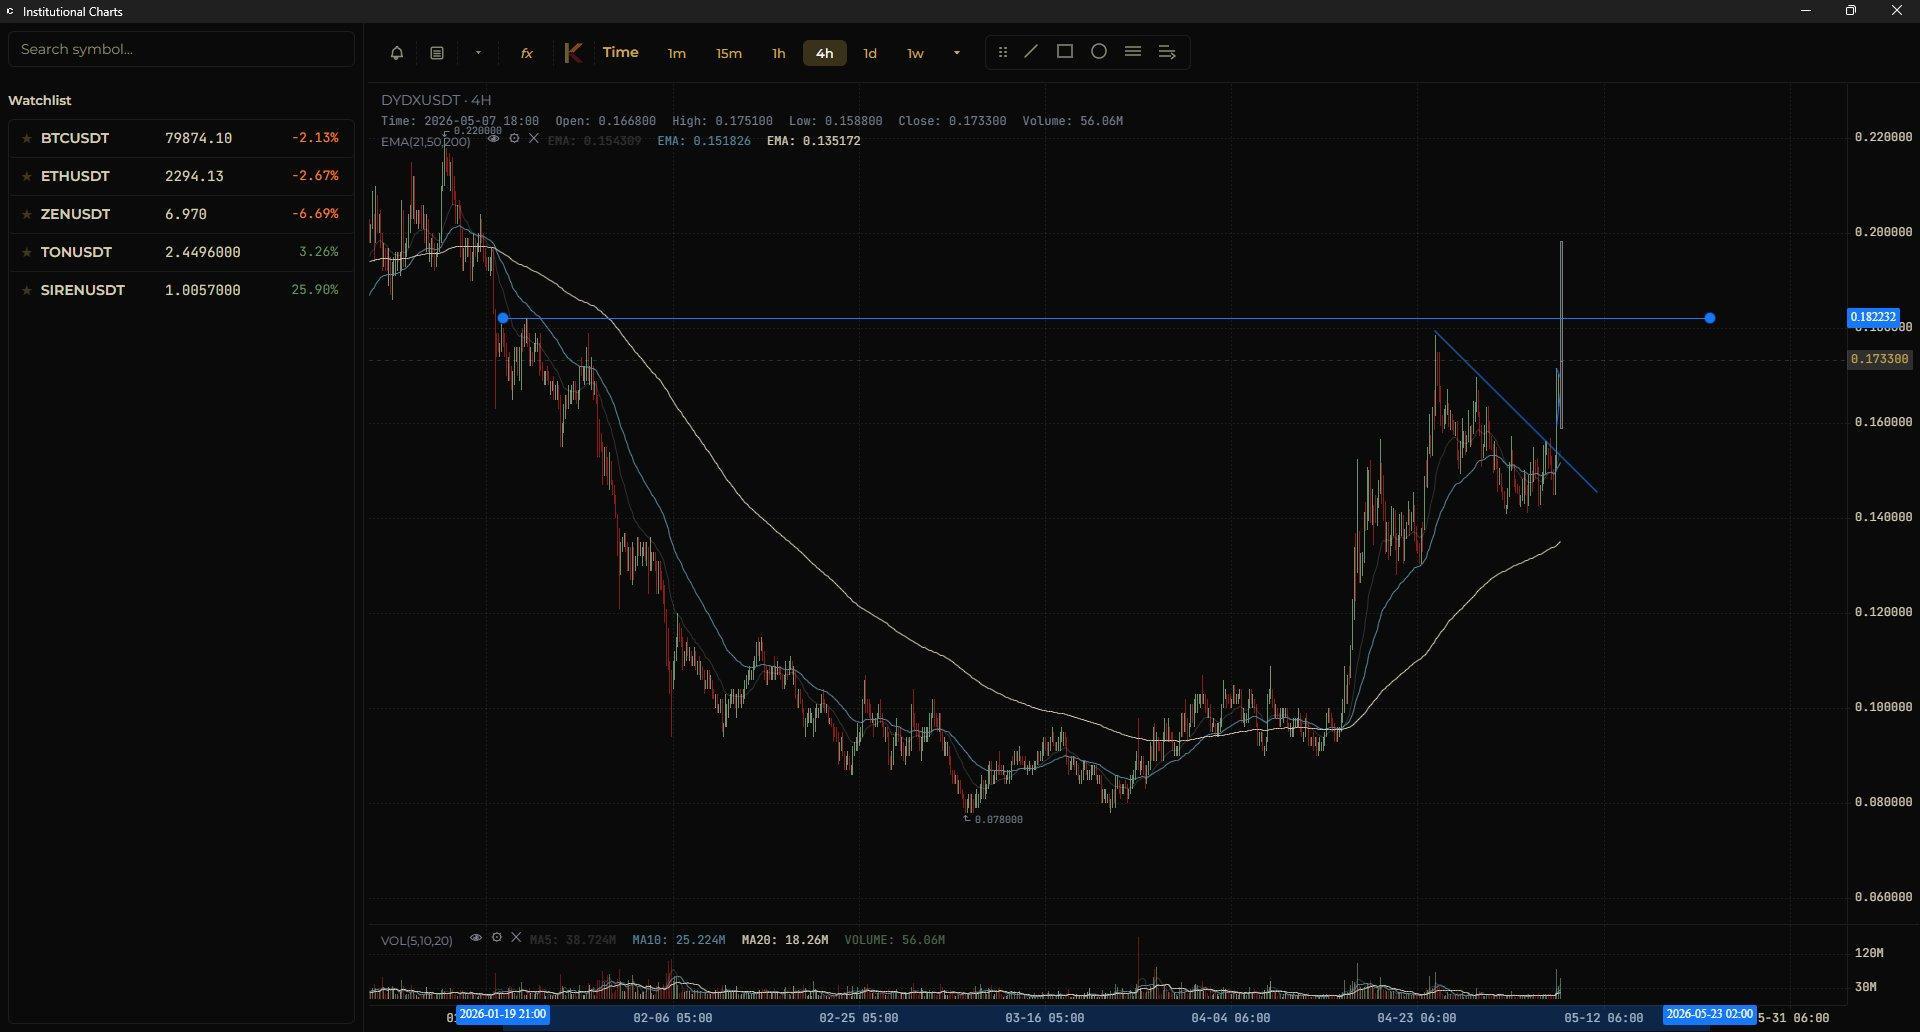
Descending wedge / triangle compressing on 4H. Breakout ongoing but capped by 0.182 resistance.
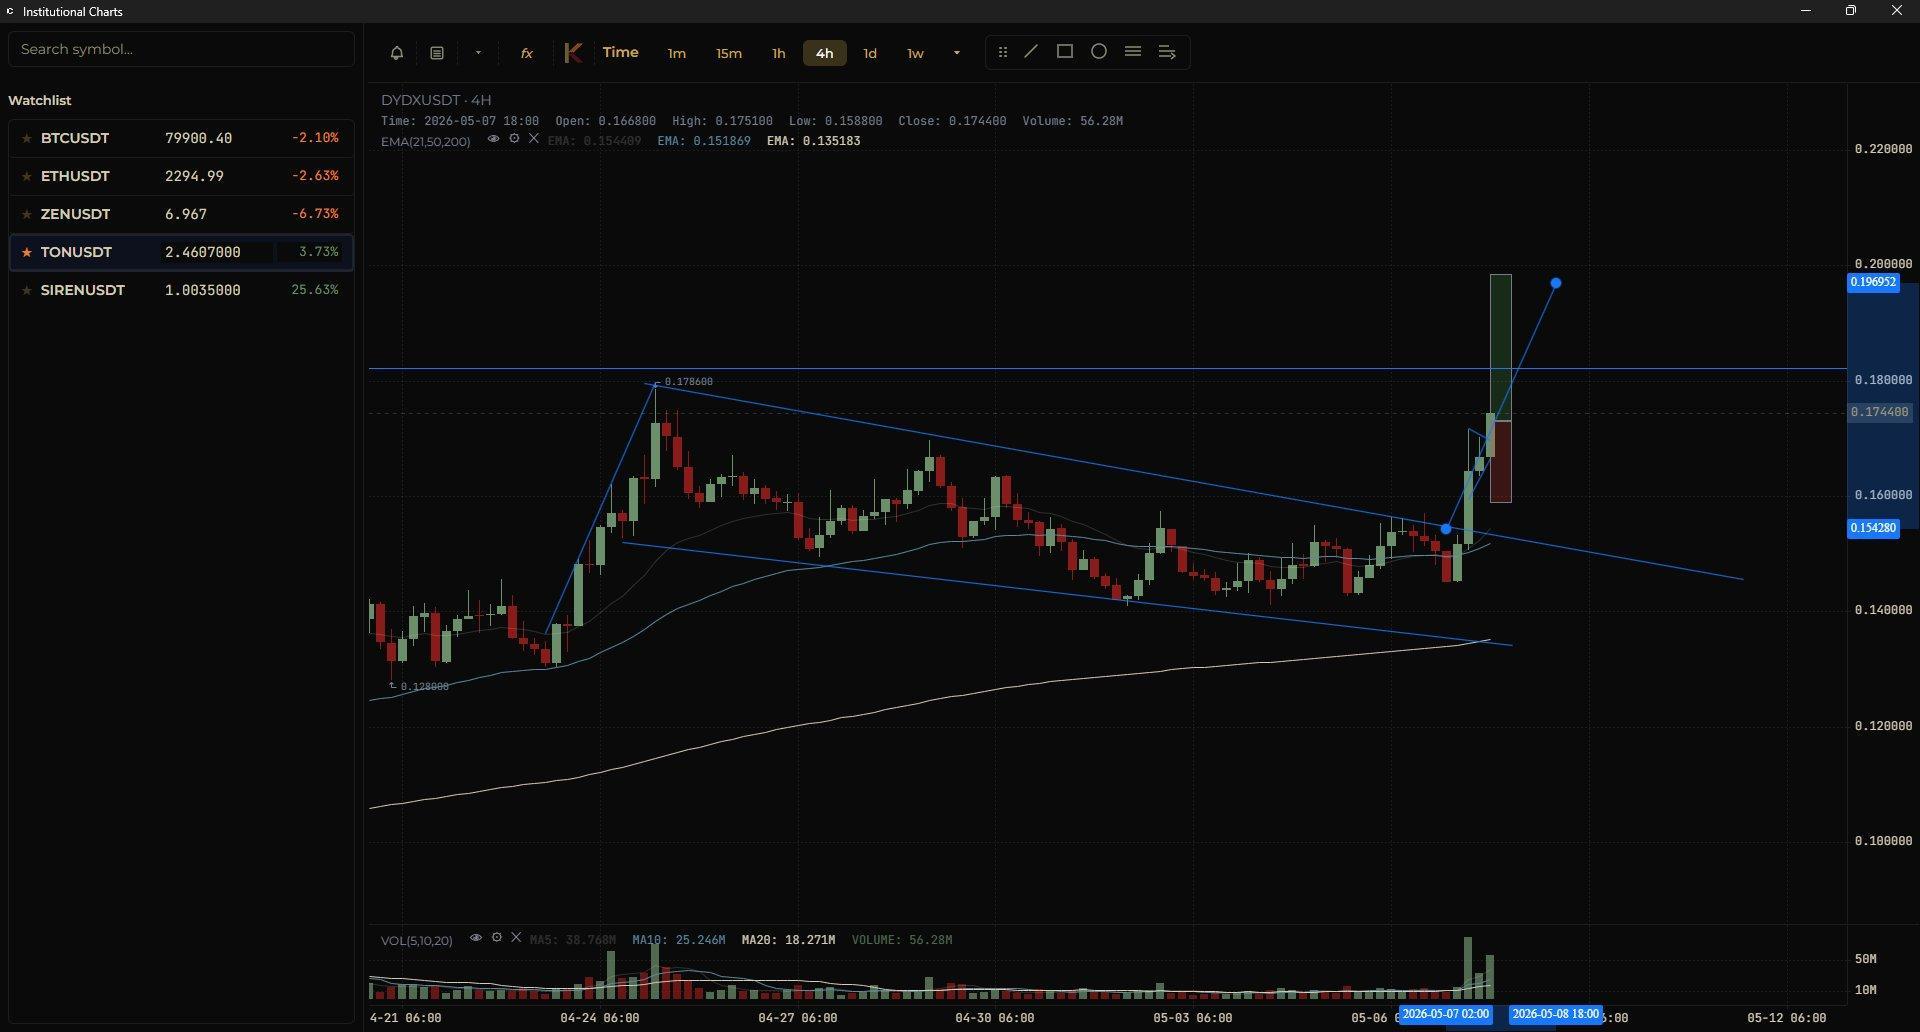
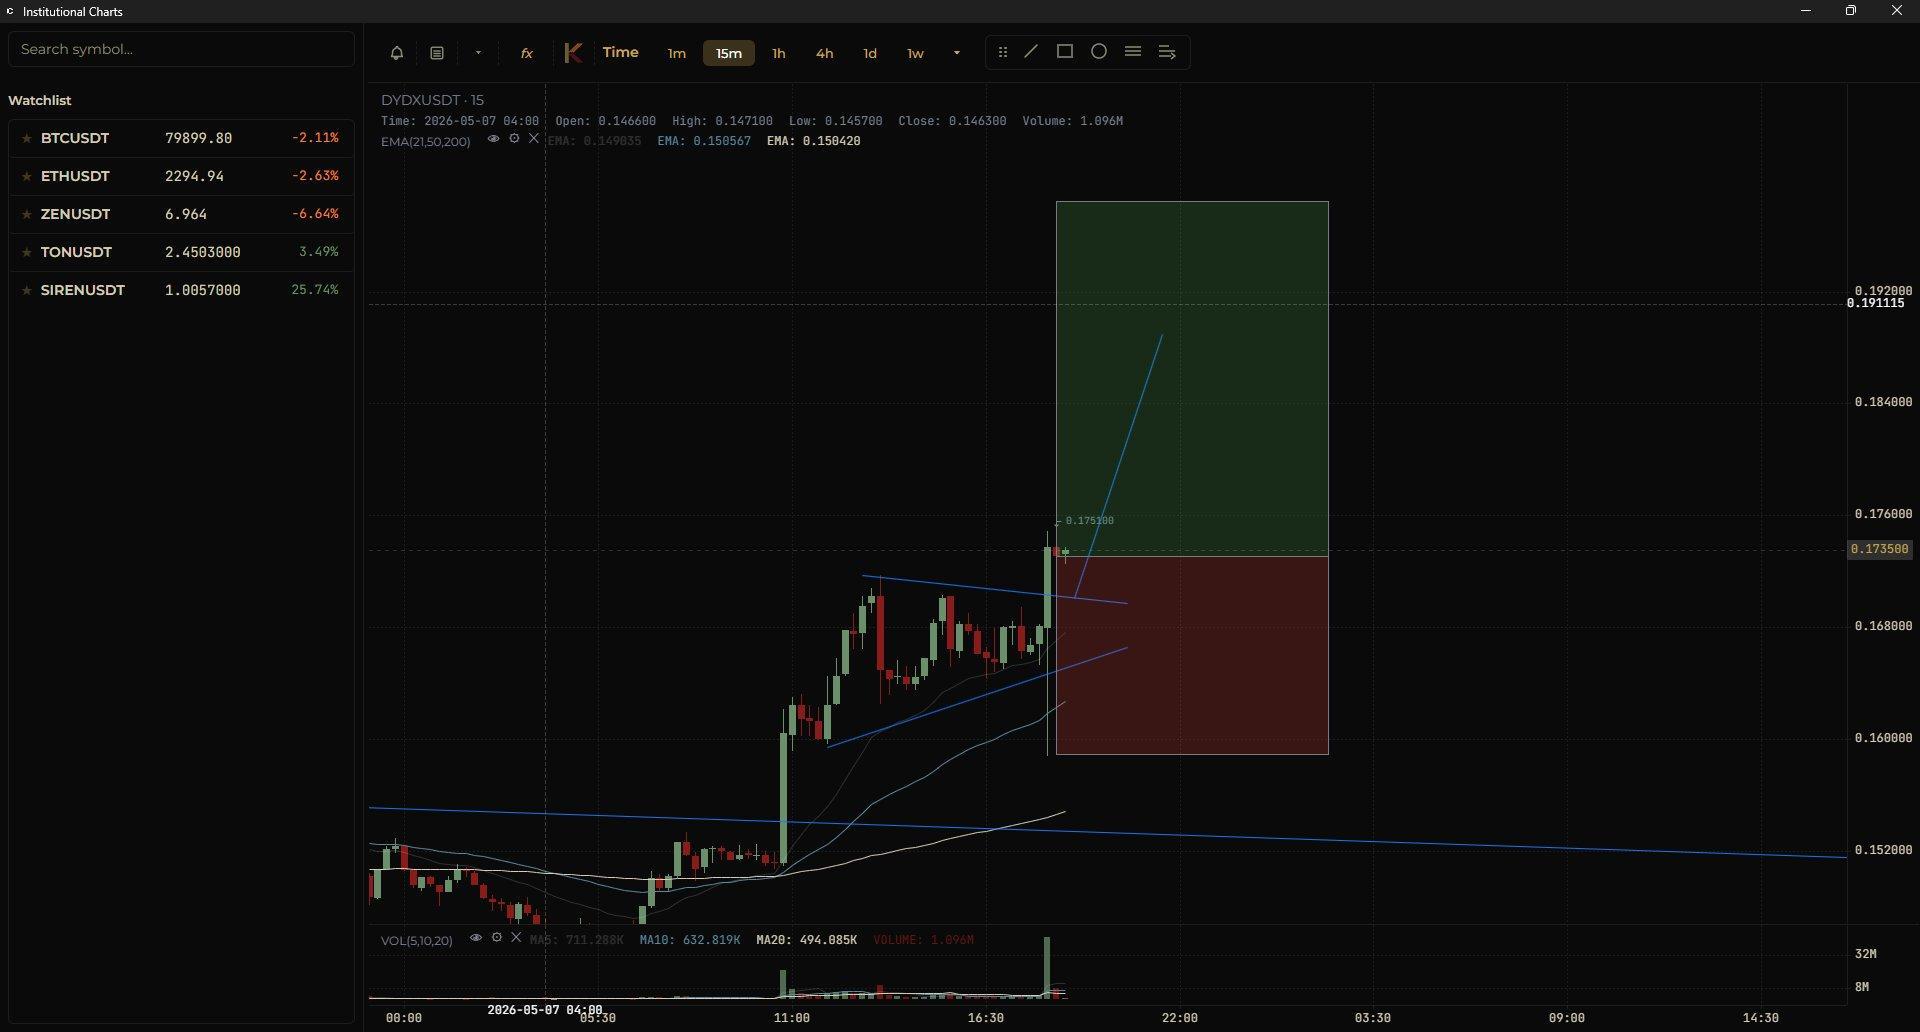
15m bull flag breakout with volume. Green target box to 0.208. Red invalidation box defined the stop. Clean defined R:R setup with 4H wedge providing the macro tailwind.
Price hit 0.208, target achieved. Hours later, all gains erased. This was not a surprise. Late trend + lower cap + major resistance = exit at target, do not hold. The IC Konsole signal was valid. The exit discipline was the edge.
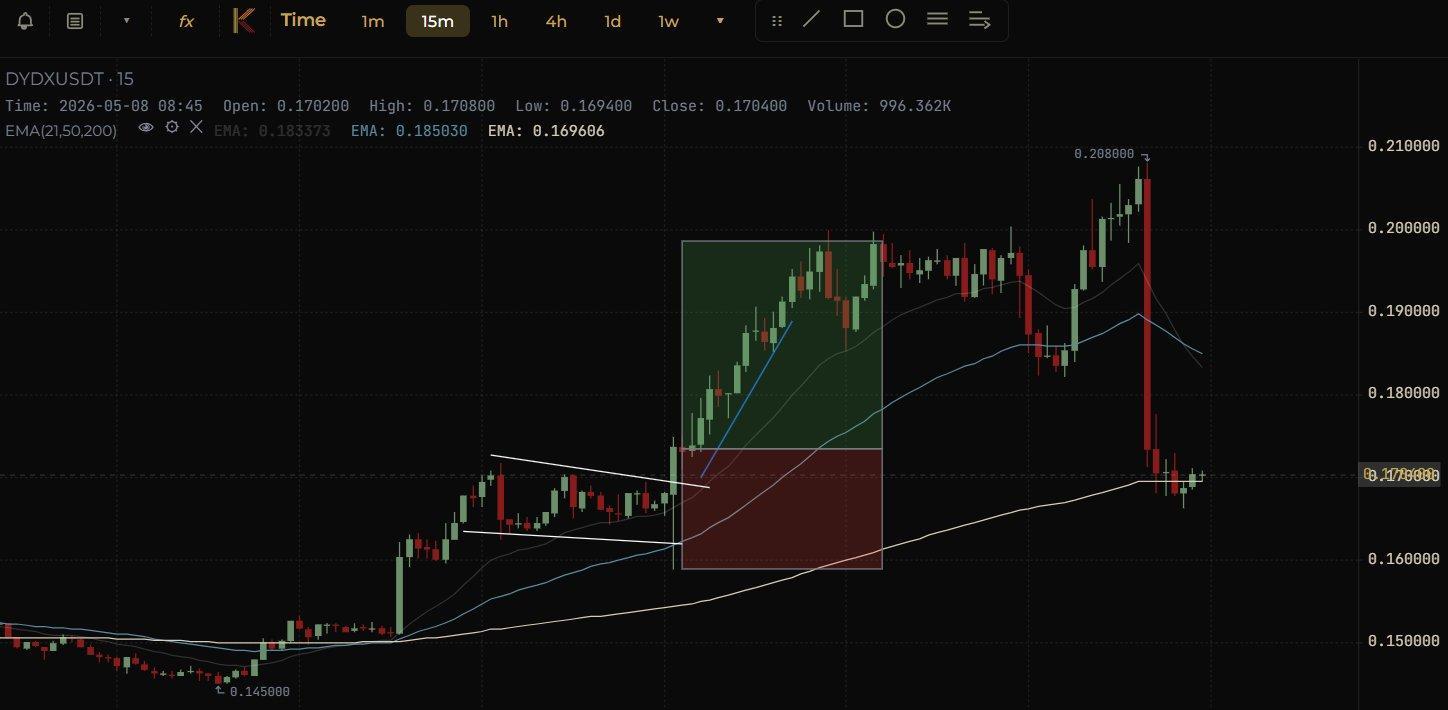
- Strong IC Konsole data, but context classified this as scalp, not swing
- 4H wedge gave the macro setup. 15m flag gave the entry.
- 100M–250M market cap = faster reversals. Tighter exit discipline required.
- Target 0.208 hit. Full reversal hours later. Exit at target was the only correct decision.
- Lesson: signal quality does not change the trade type. Context does.
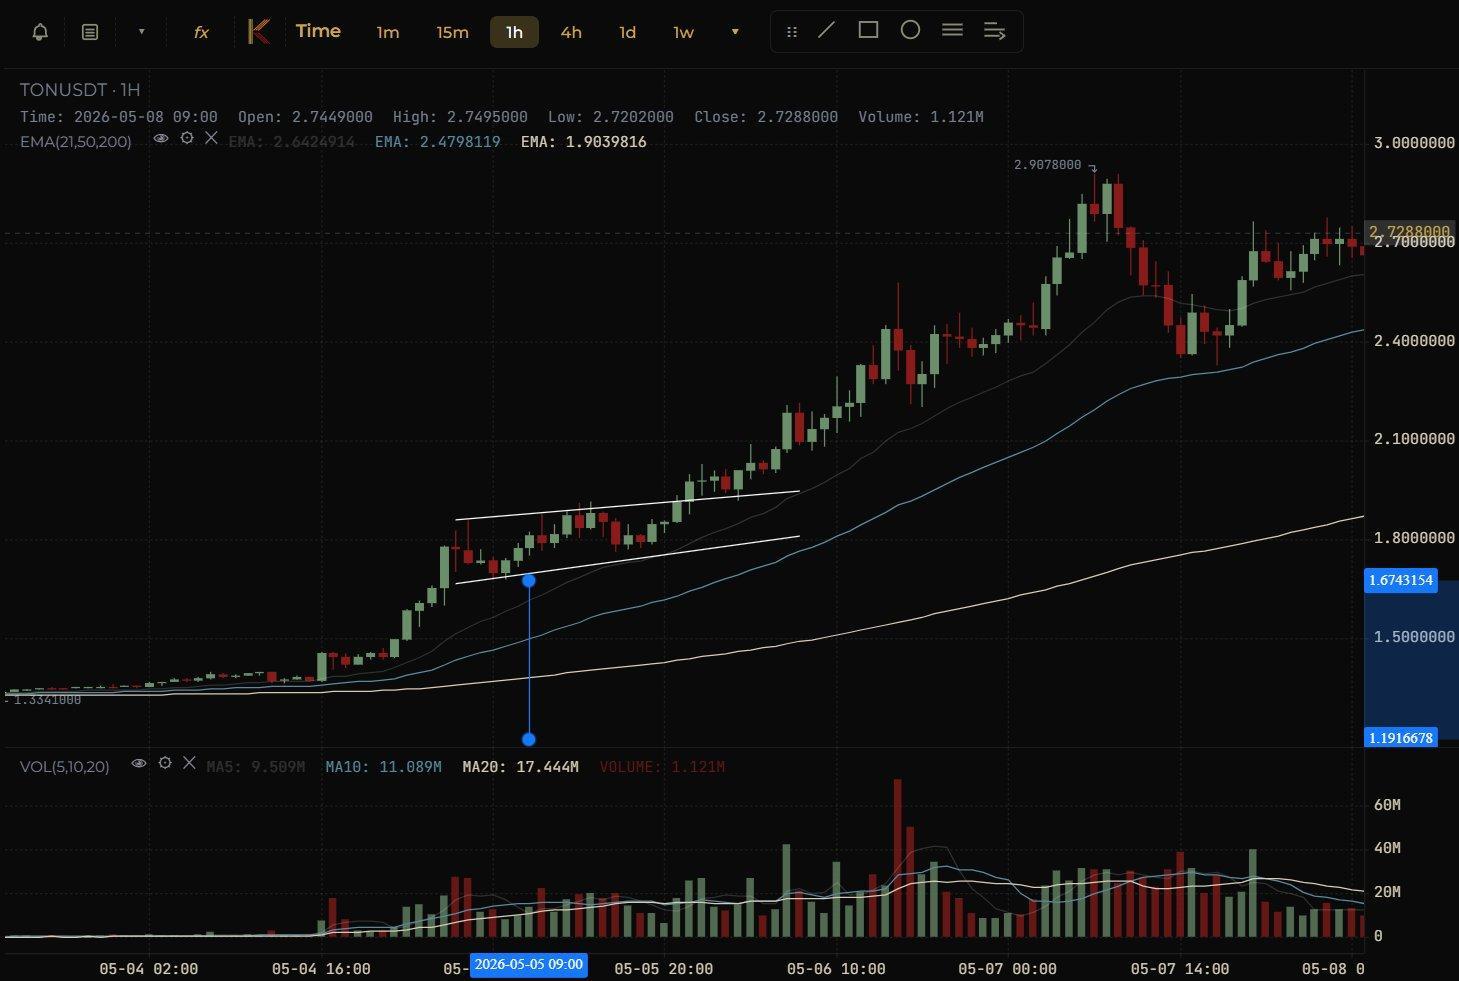
TON is the cleanest example of early participation + trend following. The signal fired at 08:42 on MAY-05. The bull flag on the 1H didn't break until 22:00 that evening, over 13 hours later. But from the moment the signal appeared, TON never looked back. Two valid entries: the 19:00 bullish engulfing candle on the 1H, or the 22:00 bull flag breakout. Both worked. The move was +74%.
TON appeared as B+ ★ (starred), 1ST SEEN MAY-05 at 08:42. P: 2.13x and D-P: 8.55x were moderate in raw numbers but the (B) score of 2.0 was strong, right in the A+ beta sweet spot. (R): 0.23 showed solid positive BTC-relative strength. Critically: the signal was persistent, TON remained on the scan for multiple sessions. That persistence was the conviction signal.
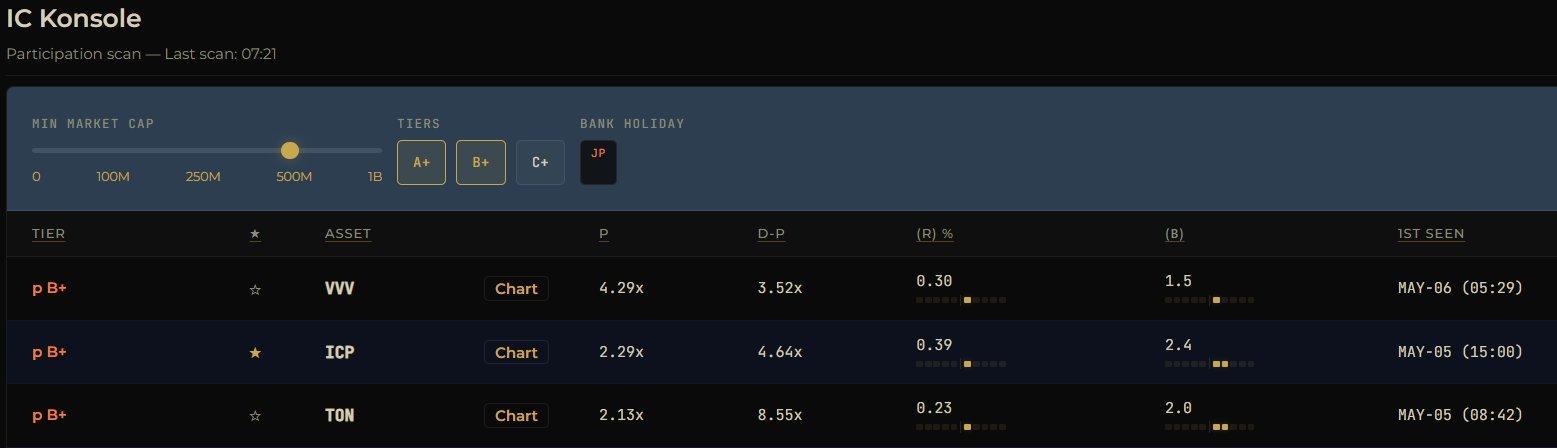
| Signal Data | Value | Interpretation |
|---|---|---|
| Tier | B+ ★ | Significant participation. Starred (watchlisted). |
| P | 2.13x | Moderate raw participation. But sustained and building. |
| D-P | 8.55x | Strong daily conviction. Full-day institutional activity. |
| (R) % | 0.23 | Solid positive BTC-relative strength. |
| (B) Beta | 2.0 | In the A+ beta sweet spot. Strong BTC amplification. |
| 1ST SEEN | MAY-05 08:42 | Morning signal. Persistent across multiple sessions. |
The 1H chart shows everything. At signal time, price was at 1.674, EMAs in perfect bullish order and fanning out. Two valid entry points:
- Entry 1: 19:00 bullish engulfing candle on the 1H: aggressive early entry on the signal candle pattern at the flag base
- Entry 2: 22:00 bull flag breakout: conservative confirmation entry when price broke above the flag resistance with volume
From signal (1.674) to peak (2.9078): +74% in under 3 days. The move began immediately at signal time and never gave back the signal level. You did not need to wait for the flag break. The trend was already running.
- Signal fired 13+ hours before the bull flag broke: early participants captured the full move
- (B): 2.0 was the standout metric: strong BTC beta in the sweet spot
- Two valid entries: 19:00 bullish engulfing (aggressive) or 22:00 flag break (conservative)
- Persistent multi-day signal = highest conviction read in IC Konsole
- High cap asset = hold for the full move. No reason to scalp a clean trend.
- +74% from signal to peak. Trend following: patience was the only skill required.
| Example | Setup Type | Key Lesson |
|---|---|---|
| JTO · B+ · +78% · 48hrs | Early signal, high cap, trend hold | Scanner fires early. Wait for pattern. Then hold. |
| DYDX · B+ · Scalp · Target hit | Late trend scalp, lower cap | Context defines the trade type. Signal quality ≠ hold time. |
| TON · B+ · +74% · 3 days | Early trend, persistent signal | Persistent multi-day signal = highest conviction. Patience = edge. |