Sigma (σ)
The calm-to-stretched curve
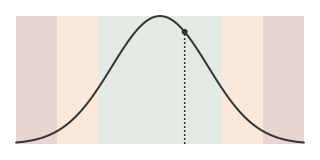
A score for today’s 4H trend energy against its own trailing history — built to resist getting dragged around by a handful of wild outliers. A typical reading sits inside the green band, close to the peak.
Takeaway: Most of the time this number sits well inside the middle band — that’s the boring, expected case.
An extreme reading
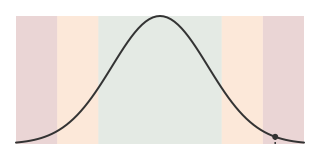
Past 2.5, the reading is out past the shoulder of the curve entirely — today’s trend energy is far outside its own normal range for this symbol.
Takeaway: This is the stretched end of the scale — the trend has gone further from normal than it usually does.
What
Sigma turns the 4H energy histogram into one number: how far today’s reading sits from its own middle, on a scale where 1 unit is a typical amount of spread. Under 1.5 is the green, ideal band; 1.5 to 2.5 is orange, less ideal; 2.5 and beyond is red, extreme. It needs about 50 stored energy readings before it’s reliable.
So what
Sigma is the single-number version of the 4H histogram — the same underlying reading, condensed to one scale so you don’t have to eyeball where the marker sits in the distribution. A green reading says nothing unusual; orange says the trend has stretched further than normal; red says it’s stretched about as far as this symbol’s own history has ever seen.
Now what
A red reading is where “the trend is extended, reduce or wait for a reset” ideas come from — not from a fixed rule, but because this tape’s own history says a distance this large rarely holds. A green reading means Sigma isn’t adding a reason to hesitate on a setup built from the other columns.